
Compare representations
From basic calculations to college calculus, students can see the same quantity in several forms. Evaluate sin(30°) as ½, switch to 0.5, and locate the value on a sine curve.
Bring the kinds of problems you teach on a TI graphing calculator to iPhone, iPad, and Mac. Students can follow an equation from an exact answer to its graph.
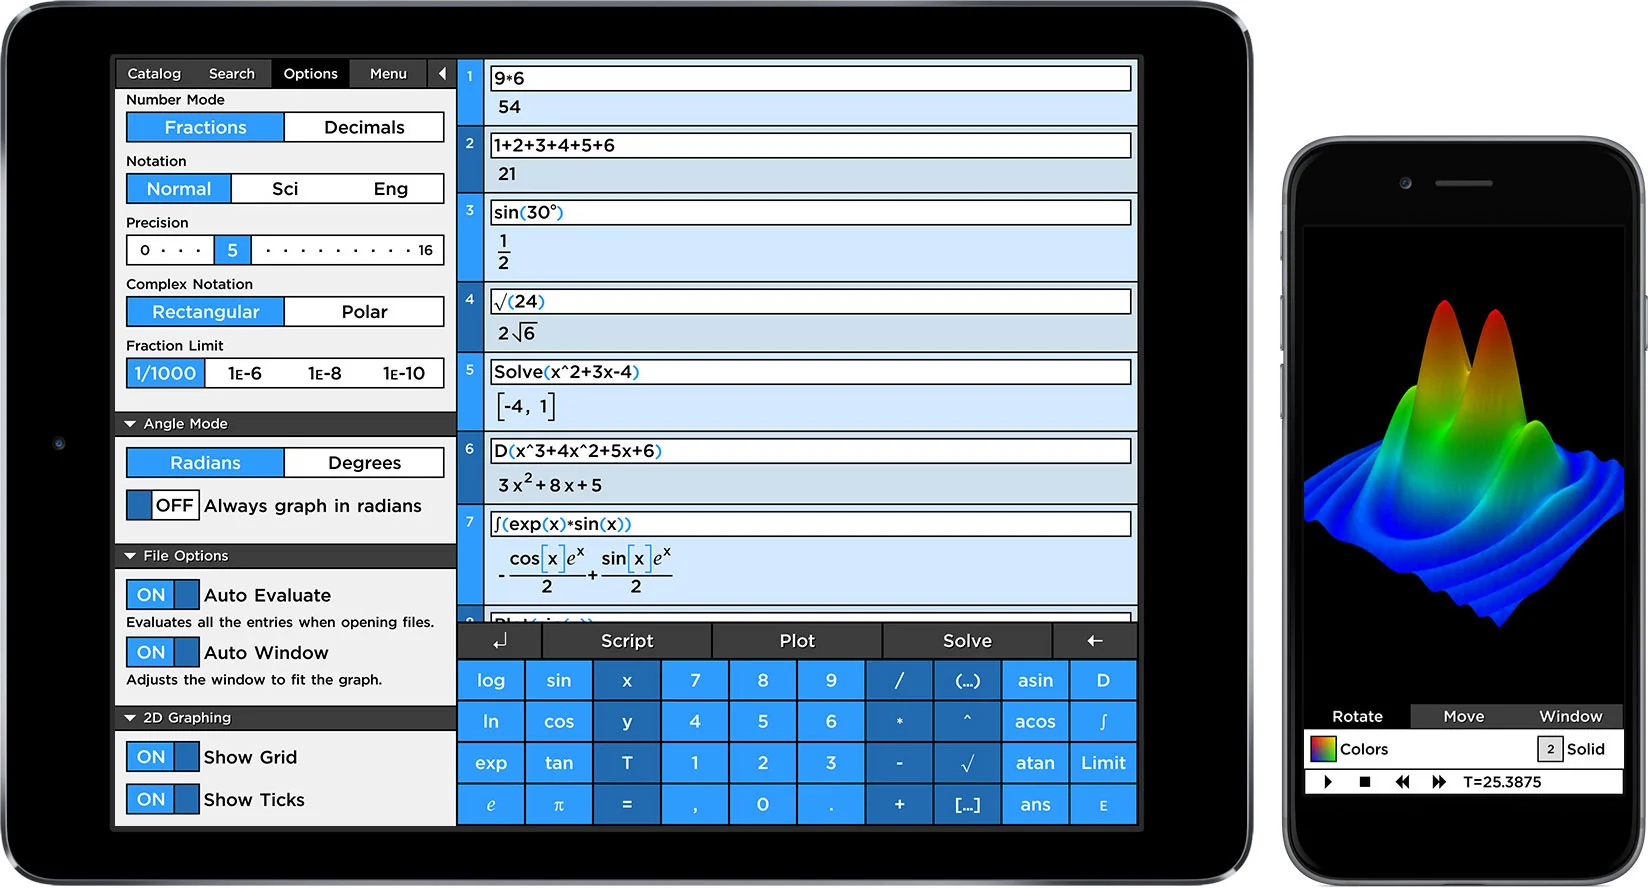
From basic calculations to college calculus, students can see the same quantity in several forms. Evaluate sin(30°) as ½, switch to 0.5, and locate the value on a sine curve.
Graph a line and a parabola on the same axes, then solve for their intersection points. Move on to parametric curves and polar graphs as the course progresses.
Enter a class set of measurements as paired lists. Draw a scatter plot, add a regression line, and ask which observations fall farthest from the model.