Discrete function plotting
This provides a few functions with simple input which produces discrete plots.
In all of these functions, the bounds are given as [firstValue,LastValue]
PlotDiscrete( f(x), NumberList bounds, Number stepSize=1 )
*plots a discrete function f(x) where the default stepsize is 1. However, any stepsize greater than 0 may be specified.
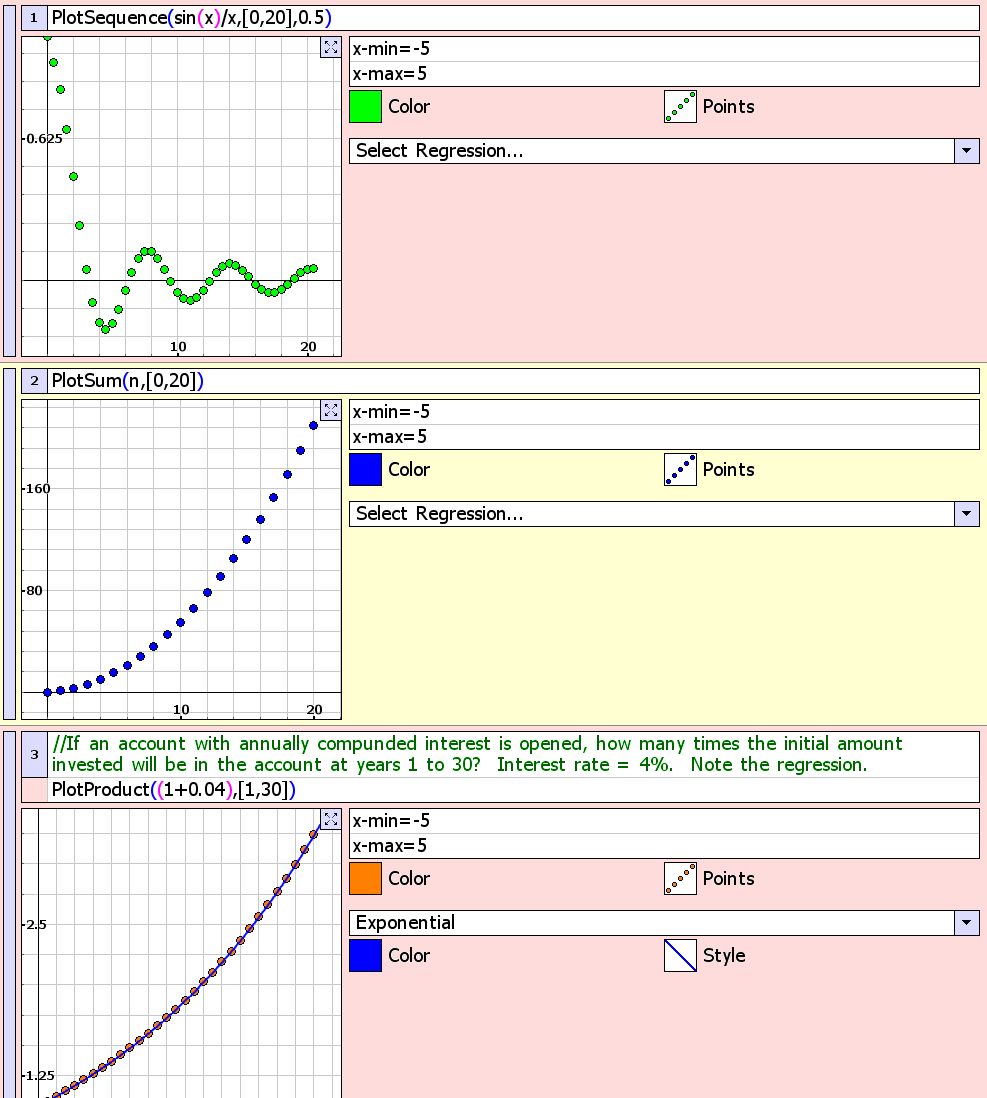
PlotSequence( f(x), NumberList bounds, Number stepSize=1 )
*plots a sequence given by f(x)
PlotSum( f(n,x), NumberList bounds )
*plots the progression of the summation of a function f(n,x) between the given bounds where n is the step of the summation and x is the independant variable.
PlotProduct( f(n,x), NumberList bounds )
*Plots the product function f(n,x) between the given bounds where n is the step of the product and x is the independent variable.


