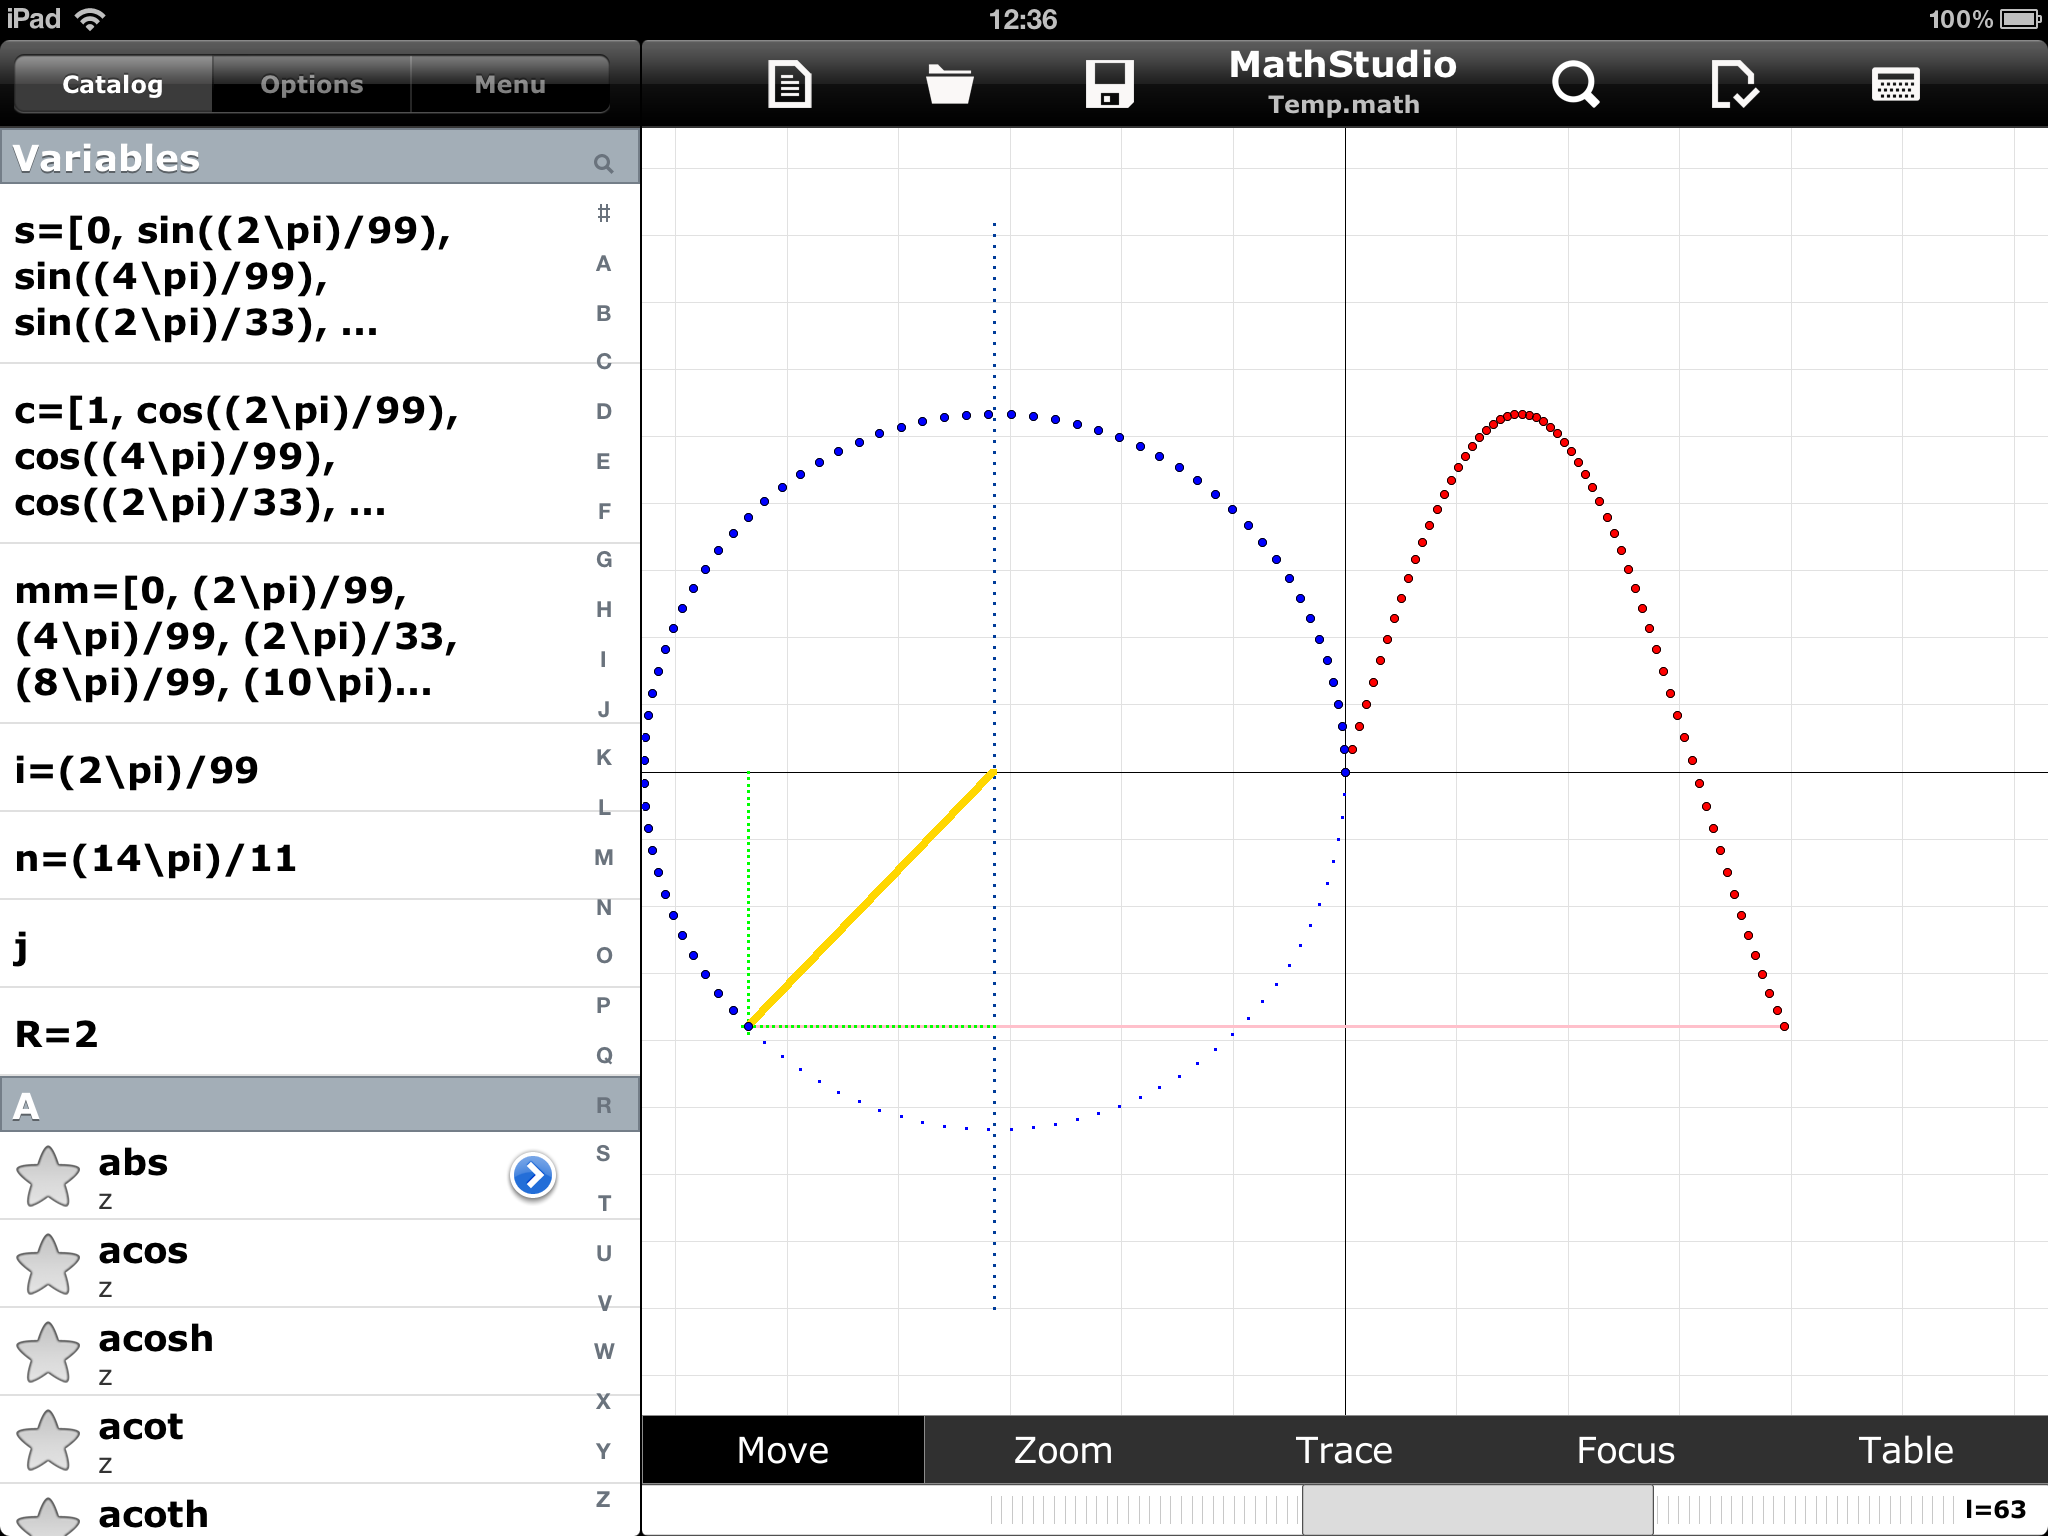
Sin vs Circle
This script plots a circle and a sinusoid using many kind of plots.
It shows a segment line in rotation following the circle plot. All the plots are drawned according to a Sliders to plot them step by step.
Scroll(l,1,100)
s=List(l)
c=List(l)
mm=List(l)
i=2\pi/99
n=0
loop(j,1,l)
s(j)=sin(n)
c(j)=cos(n)
mm(j) = n
n=n+i
end
MultiPlot(Plot(Choose(x>=c(l)*2\pi+2\pi,Choose(x<=mm(l)*2,s(l)/1.5)),lines=2,color=pink),ParametricPlot(2\pi*cos(u)-2\pi,sin(u)/1.5,u=[0,2\pi,100],style=0,points=3,color=blue),ParametricPlot(-2\pi,u,u=[-1,1,100],style=0,points=3),ParametricPlot(2\pi*c(l)-2\pi,u*s(l)/1.5,u=[0,1,40],style=0,points=3,color=green),ParametricPlot(u*2\pi*c(l)-2\pi,s(l)/1.5,u=[0,1,40],style=0,points=3,color=green),ParametricPlot(u*c(l)*2\pi-2\pi,u*s(l)/1.5,u=[0,1,256],color=gold,lines=5),ListPlot(mm*2,s/1.5),ListPlot(c*2\pi-2\pi,s/1.5,color=blue),x=[-12.6,12.6],y=[-1.2,1.2],numbers=0)


